Most quick deal analyses stop at year one: what does the property earn today, after expenses and the mortgage? That is a useful filter, but it can badly misjudge a deal. A property with thin cash flow today can be an excellent long-term investment, and a property with strong year-one numbers can disappoint over time.
Long-term projections close that gap.
What year-one analysis misses
A single-year snapshot ignores several forces that shape real estate returns:
- Rent growth: rents usually change over time, and even modest annual increases compound.
- Expense growth: taxes, insurance and maintenance usually rise as well.
- Loan paydown: every payment builds equity, and the amount grows each year.
- Appreciation: changes in property value often make up a large share of total return.
- Taxes: depreciation, deductions and the tax due on sale all affect what you actually keep.
The four sources of real estate return
A long-term projection shows how each of these builds over time:
- Cash flow from rent after expenses and debt service
- Principal paydown from the mortgage balance falling
- Appreciation in the property's market value
- Tax effects, including depreciation that can offset rental income
Looking at all four together is the only way to compare, for example, a high-cash-flow property in a slow market with a lower-cash-flow property in a growing one.
Why taxes belong in the model
Two investors can buy identical properties and end up with very different after-tax results. Depreciation can reduce taxable rental income for years, while tax on the eventual sale can take a meaningful share of the gain. A tax-aware projection shows returns on an after-tax basis, which is the number that matters to you.
Tax rules vary by country, state and personal situation, so always confirm your specific assumptions with a qualified tax professional.
Assumptions that matter most
Long-term projections are only as good as their inputs. Pay close attention to:
- Rent growth rate: base it on the local market's history, not national headlines.
- Expense growth rate: property taxes and insurance can rise faster than rent in some markets.
- Appreciation rate: be conservative; small changes compound dramatically over 30 years.
- Vacancy and CapEx: older properties need larger reserves as major systems age.
- Holding period and exit costs: selling costs and taxes on sale can change the result significantly.
Use scenarios, not a single forecast
Nobody knows exactly what rents or values will do. Instead of one projection, compare three:
- Conservative: low rent growth, low appreciation, higher expenses
- Expected: your most realistic assumptions
- Optimistic: stronger growth
If a deal only works in the optimistic scenario, that tells you something important about its risk.
Metrics to compare over time
For each year of the projection, look at:
- Annual and cumulative cash flow
- Loan balance and equity
- Total return, including appreciation and paydown
- After-tax cash flow and after-tax profit on sale
- Return on equity, which shows when your capital might work harder elsewhere
That last point is often overlooked. As equity grows, return on equity usually falls. Projections help you decide when a refinance or a sale and reinvestment makes sense.
Building projections without a giant spreadsheet
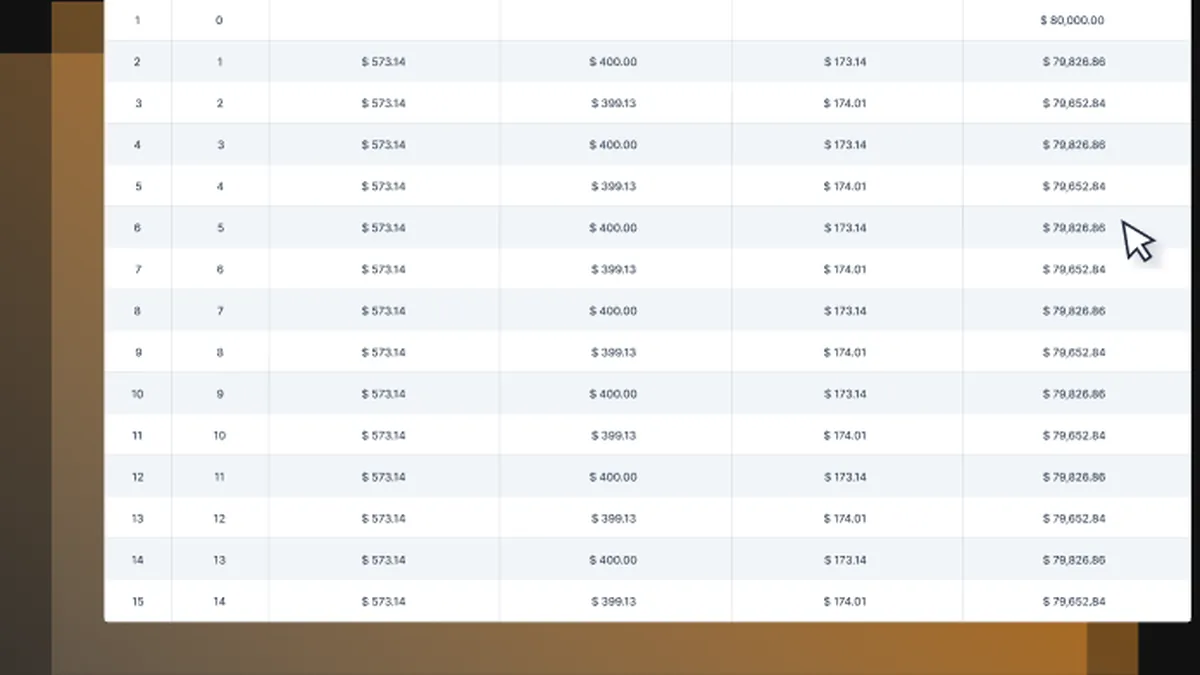
Custom spreadsheets can model all of this, but they are time-consuming to build and easy to break. The Viqsa Deal Analyzer includes a long-term investment forecast with 30-year, tax-aware projections and full amortization schedules. You can save default assumptions, compare scenarios and export results to share with partners or lenders. It runs as a desktop app with your data stored locally, and its AI Copilot can help you test the assumptions behind each projection.
Key takeaway: Judge a property by its full return over your holding period, including cash flow, loan paydown, appreciation and taxes, under more than one scenario. Year-one numbers are the starting point, not the answer.