Measuring productivity for field teams is harder than for office teams. Work happens across many locations, jobs vary in size and travel time is unavoidable. Without clear metrics, managers fall back on gut feeling, which is rarely fair to the team or useful for the business.
The right key performance indicators (KPIs) give a balanced view. Here are eight worth tracking.
1. Jobs completed per worker per day
The simplest productivity measure. Track it by worker, team and job type, and look at trends rather than single days. Compare like with like, because a technician doing complex installations will complete fewer jobs than one doing routine inspections.
2. First-time fix rate
The percentage of jobs completed on the first visit without a return trip. A low rate usually points to missing parts, incomplete job information or skills mismatches, all of which can be fixed.
3. On-time arrival rate
The share of visits where the worker arrived within the promised window. It affects customer satisfaction directly and often reveals scheduling or routing problems.
4. Average time on site
How long each job type takes on average. Unusually long times can indicate training needs, difficult sites or jobs that are being underestimated in scheduling.
5. Travel time as a percentage of working time
Time spent driving between jobs is necessary but not productive. If travel takes a large share of the day, better job grouping and route planning can free up capacity for more work.
6. Utilisation rate
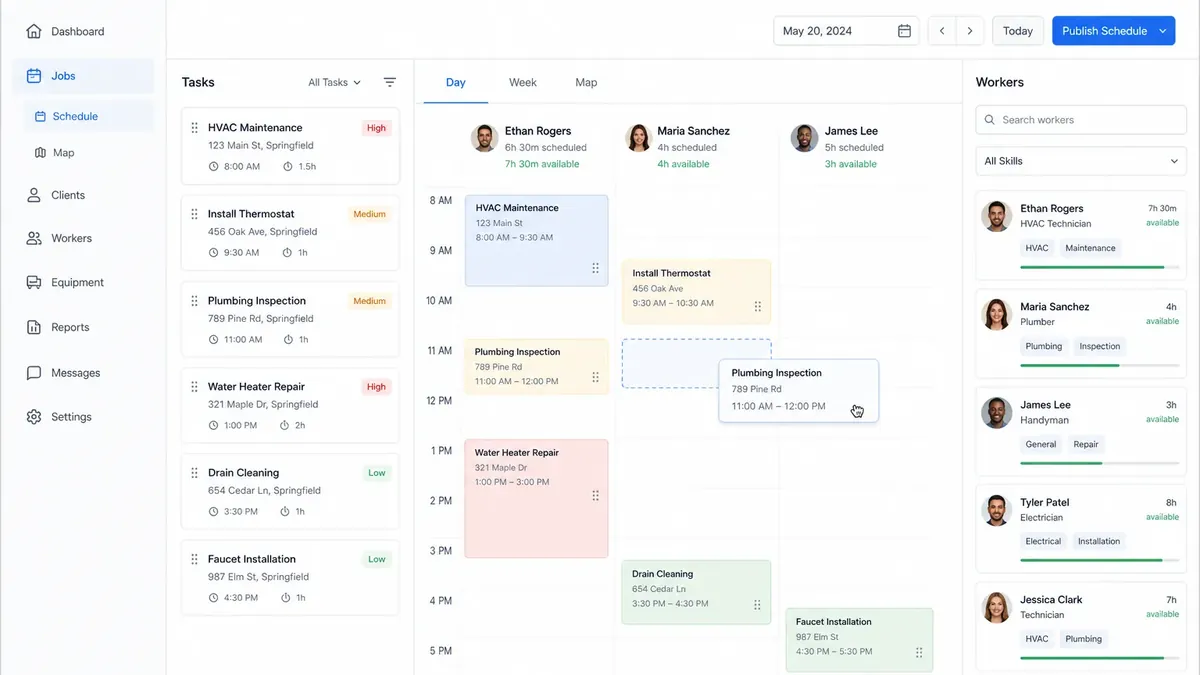
The proportion of paid working hours spent on productive work, such as travelling to and completing jobs, compared with idle or waiting time. Very low utilisation suggests scheduling gaps; very high utilisation can mean the team is overloaded.
7. Attendance accuracy
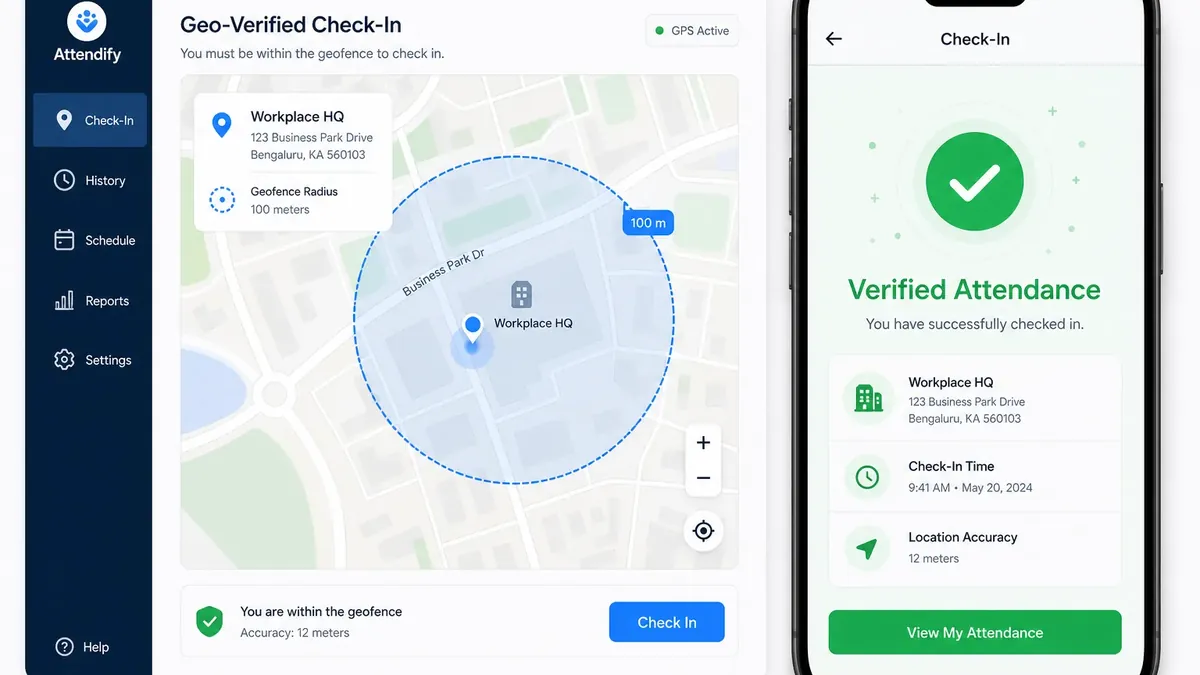
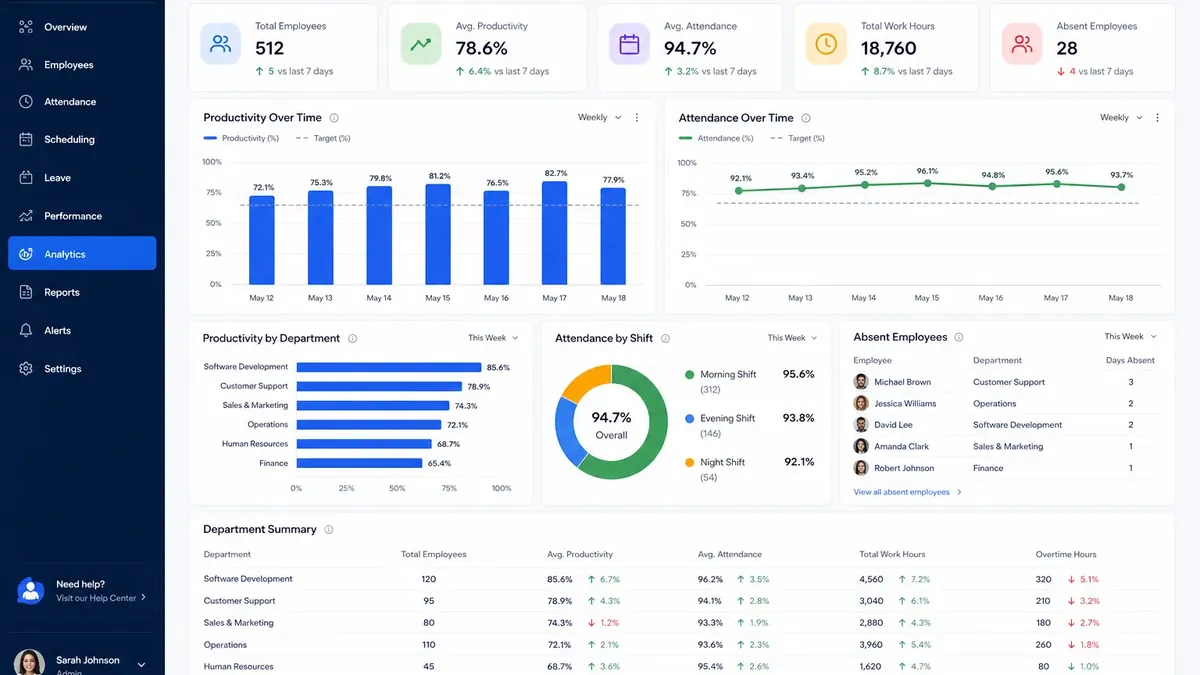
The share of shifts with on-time check-ins and complete records. Accurate attendance is the foundation for fair payroll and reliable scheduling.
8. Time from job completion to invoice
How quickly completed work turns into a bill. Paper job sheets and manual data entry can add days or weeks. Digital proof of work shortens this cycle and improves cash flow.
Using KPIs fairly
Metrics should support people, not punish them. A few guidelines:
- Compare similar work. Different job types, areas and customers have different norms.
- Look at trends. One bad day is not a pattern.
- Combine metrics. High jobs per day with a low first-time fix rate is not a success.
- Share the data. Teams improve faster when they can see their own numbers.
- Ask why. Every unusual number is a prompt for a conversation, not a conclusion.
Setting targets
Start by measuring your current baseline for a month. Then set realistic improvement targets for the two or three metrics that matter most to your business, for example raising first-time fix rate or reducing travel time. Review progress monthly and adjust.
Where the data comes from
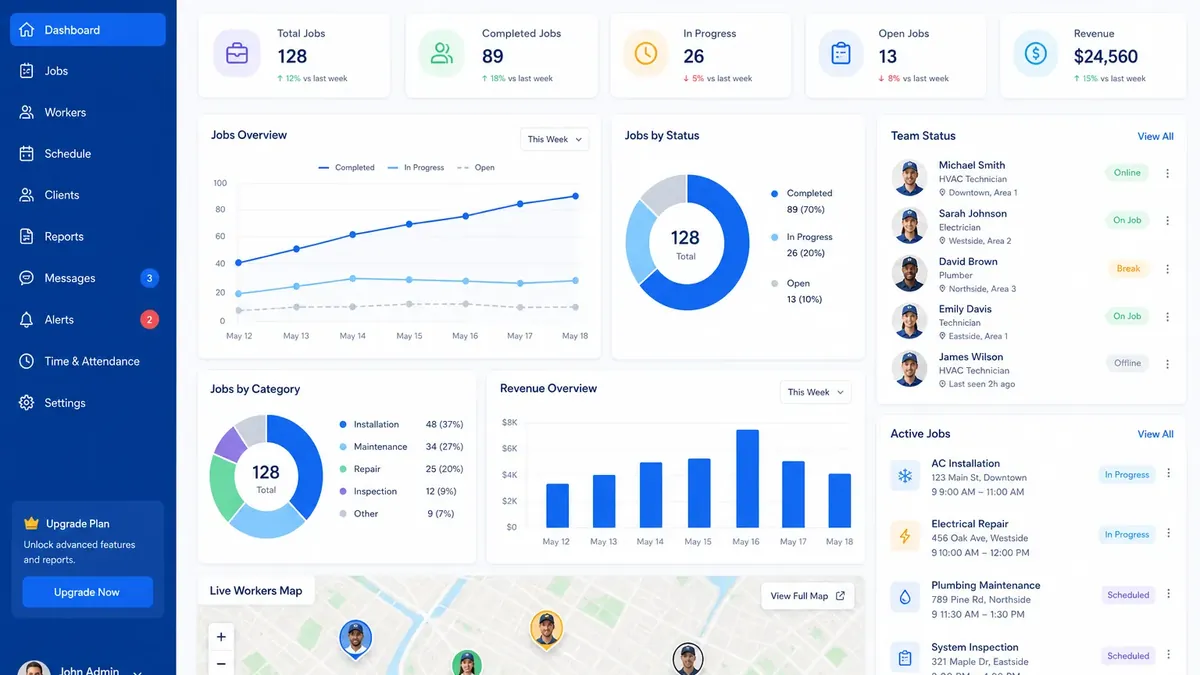
Manually collecting these numbers from timesheets and job sheets is time-consuming and error-prone. A field management system captures most of them automatically: check-ins give attendance and time on site, GPS gives travel time, and job records give completion, fix rate and invoicing time.
The Viqsa Field Worker Management System records attendance, locations, job status, photos and customer signatures as work happens. Its analytics help managers track productivity, improve attendance accuracy, respond to customers faster and reduce paper-based processes.
Key takeaway: Track a balanced set of KPIs covering output, quality, timeliness and efficiency, compare similar work fairly and use the numbers to start conversations. That is how field teams get more productive without burning out.